AI in reporting
Three concepts that help people understand, build and maintain reports, without taking decisions away from them.
AI in reporting at a glance
Three AI concepts for reporting: insights that explain a report’s data, describing a report in plain language to build it, and reporting-health recommendations for admins. AI proposes; people decide.
Outcome. Participants said the concepts addressed major pain points. The work was later deprioritised in favour of the platform migration.
- 3
- AI concepts across the reporting lifecycle
- 15
- end users saw them in the Report Library RITE prototype
- 6
- design principles, from grounded to reversible
- 0
- changes AI makes without the user choosing
My roleDesigner on Report Library and Report Builder · Designed all three concepts · Put them in front of 15 users in the Report Library RITE prototype
Insights you can check
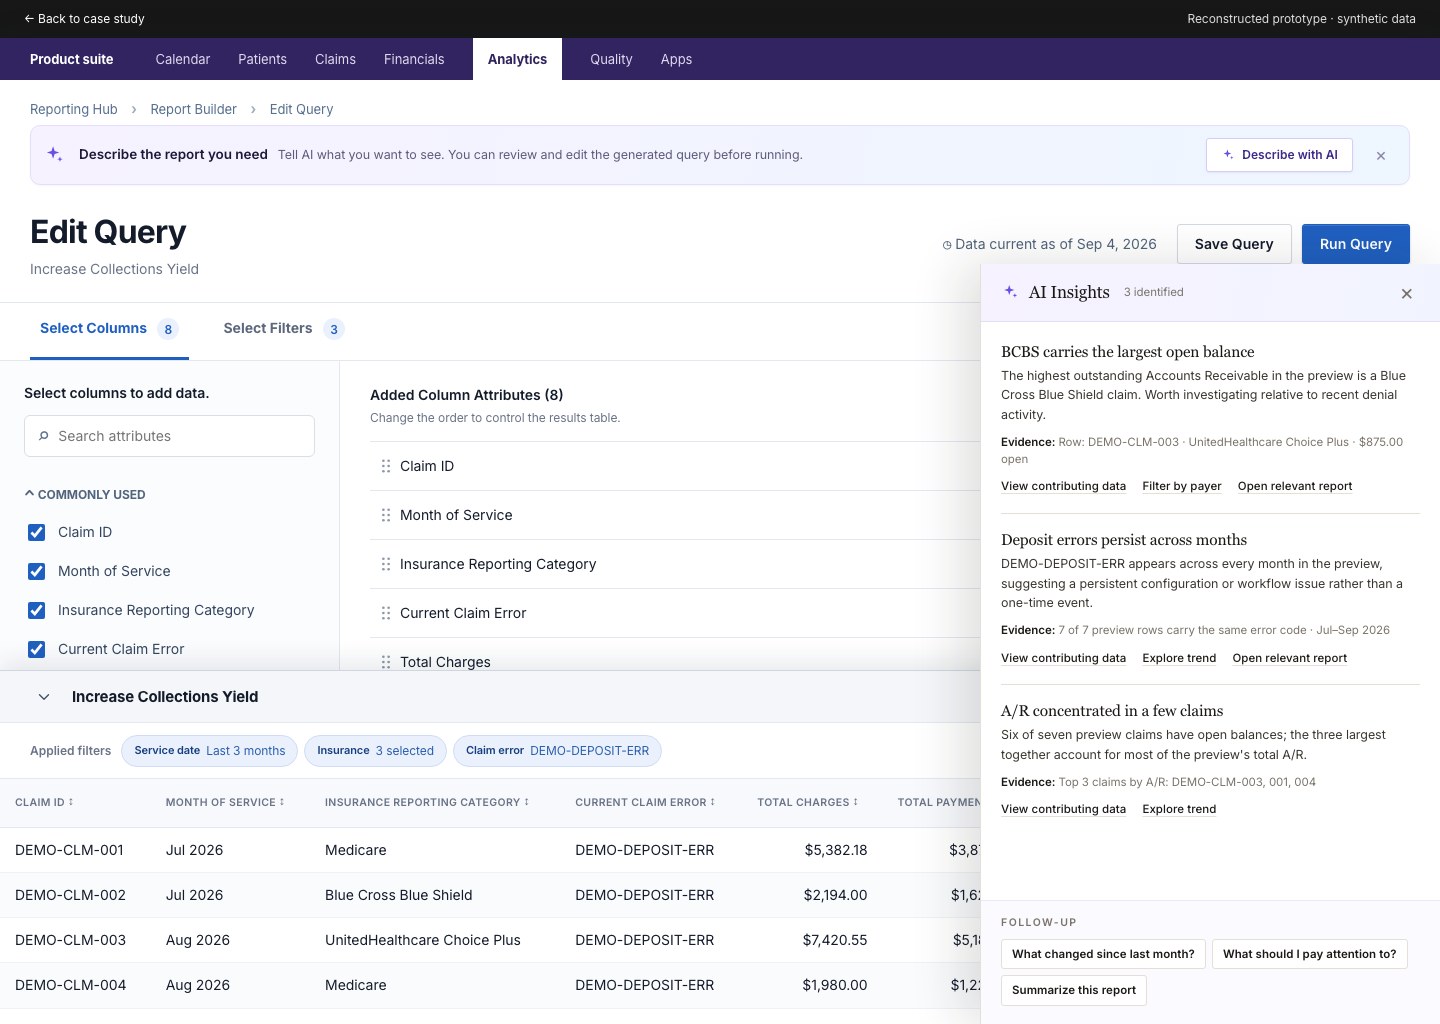
Two or three observations from the report’s own data, each linked to the rows behind it.
Describe it, then edit it
A plain-language request becomes columns and filters in Report Builder, tagged as AI-drafted.
Recommend, never act
Library-health suggestions show the system fact and the reasoning. AI never archives or pauses on its own.
Captured from the interactive prototypes with synthetic data.
Full case study
Problem
Running a report returned data, not meaning. Building one meant thinking in data terms. And libraries grew faster than anyone could clean them. Each was a moment where people needed help without losing control.
Context
I explored these concepts as the designer on Report Library and Report Builder. They covered three moments: interpreting a report, describing the report you need, and keeping the library healthy.
Process
I designed each concept around one rule: the report, its data and the user's decision stay in view. All three were included in the Report Library RITE prototype so participants could react to them during testing. Because Report Library connects to Report Builder, the test included a flow from the library into Report Builder, where report insights appeared.
Exploring AI across the reporting lifecycle
I explored moments where AI might help users interpret results, express reporting intent, or review library health. The concepts kept the report, its data, and the user's decisions in view. All three were included in the Report Library RITE prototype for exploratory feedback. They are not presented as shipped features or measured impact.
- 01Run report
- 02UnderstandAI
- 03InvestigateAI
- 04BuildAI
- 05Schedule
- 06MaintainAI
Interpreting a report
Running a report returned the data, not the meaning. Experienced users already knew the surface metrics mattered; the harder question was what changed and where to look next.
- Problem
- Users had to visually diff numbers across periods and open other reports to understand why.
- AI intervention
- A contextual "Show me insights" surfaces 2–3 observations grounded in the report's own data.
- User control
- Each insight links back to contributing rows; users decide what to investigate next.

Describing the report you need
Users often knew the business question — show denied claims by payer — but not the data model, dimensions, or filters needed to build it. The gap was translation, not intent.
- Problem
- Report Builder asks users to think in data terms. Not every user does.
- AI intervention
- Natural-language intent is translated into a transparent, editable Report Builder configuration.
- User control
- Report Builder remains the source of truth. AI proposes; users review, edit, and run.


Keeping the library healthy
Admins carried the weight of a library that grew faster than it was cleaned. Most work there isn't generative — it's deciding what to review, archive, or leave alone.
- Problem
- Stale, duplicate, failing, or badly-timed reports are hard to spot without time-consuming audits.
- AI intervention
- Governed system signals produce ranked, explainable recommendations with the reasoning visible.
- User control
- AI never archives, pauses, or reschedules on its own. Every action remains a human decision.


Six commitments the design kept, from first prompt to final action.
All three concepts were included in the Report Library RITE prototype for exploratory feedback. Participants responded positively and said the concepts addressed major pain points in their current reporting work. This supported their perceived value; it did not establish sustained usage or measurable impact. The concepts were later deprioritized as work shifted toward foundational Sigma migration and platform capabilities.
Walk the interactive extensions: Report Builder — Insights & Describe your report → Report Library — Reporting health →
Key Decisions
- A few grounded insights, not a full analysis. "Show me insights" surfaces two or three observations from the report's own data, each linked to the rows behind it, so users can check it rather than trust it.
- Translate intent into an editable configuration. A plain-language request becomes columns and filters in Report Builder, tagged as AI-drafted. Report Builder stays the source of truth; nothing runs until the user chooses.
- Recommend, never act. Library-health suggestions come with the system fact and the reasoning visible. AI never archives, pauses or reschedules on its own.
- Separate fact from interpretation. Every recommendation shows what the system knows apart from what the AI infers, so users can judge both.
Outcome
Participants responded positively and said the concepts addressed major pain points in their current reporting work. That supported their perceived value; it did not establish sustained usage or measurable impact. The concepts were later deprioritized as work shifted toward foundational Sigma migration and platform capabilities.
How this scales
Follow-up thinking, 2026 · Built in the prototype · Not tested with users
Looking back, the reporting-health concept showed one recommendation per report. That works with four. In a library of hundreds, an admin would face a wall of cards. I reworked the admin view around one rule: the facts sit on top, AI explains, and the table is where people act.
- Facts stay facts. The summary numbers count what the system knows. Each one is also a filter, with the same name as the matching filter on the table.
- One insight, not a feed. A single critical insight in one line, “One change upstream is behind 4 of your 5 failing reports,” with three more behind a teaser. Each says what it is based on and can be dismissed.
- Act in the table, in bulk. Filters for failing, inactive, ownerless and possibly duplicate reports. Select many, act once, and undo any row.
- The sparkle means judgement. Only AI inferences carry it: the insights, possible duplicates, and the likely reason a schedule is paused or slow. A failed run is a fact, so it is never marked as AI.
- Reasons where people ask why. A paused schedule shows the system fact, such as “auto-paused after 3 failed runs”, and separately the AI’s likely reason with what it is based on.


Lessons
- Useful AI in data products shows its evidence.
- Let AI propose; keep the decision with the person accountable for it.
- Positive feedback on a concept is a starting signal, not proof of value.