Leadership Dashboard
One screen for the signals a leader had been collecting from many places
Leadership Dashboard at a glance
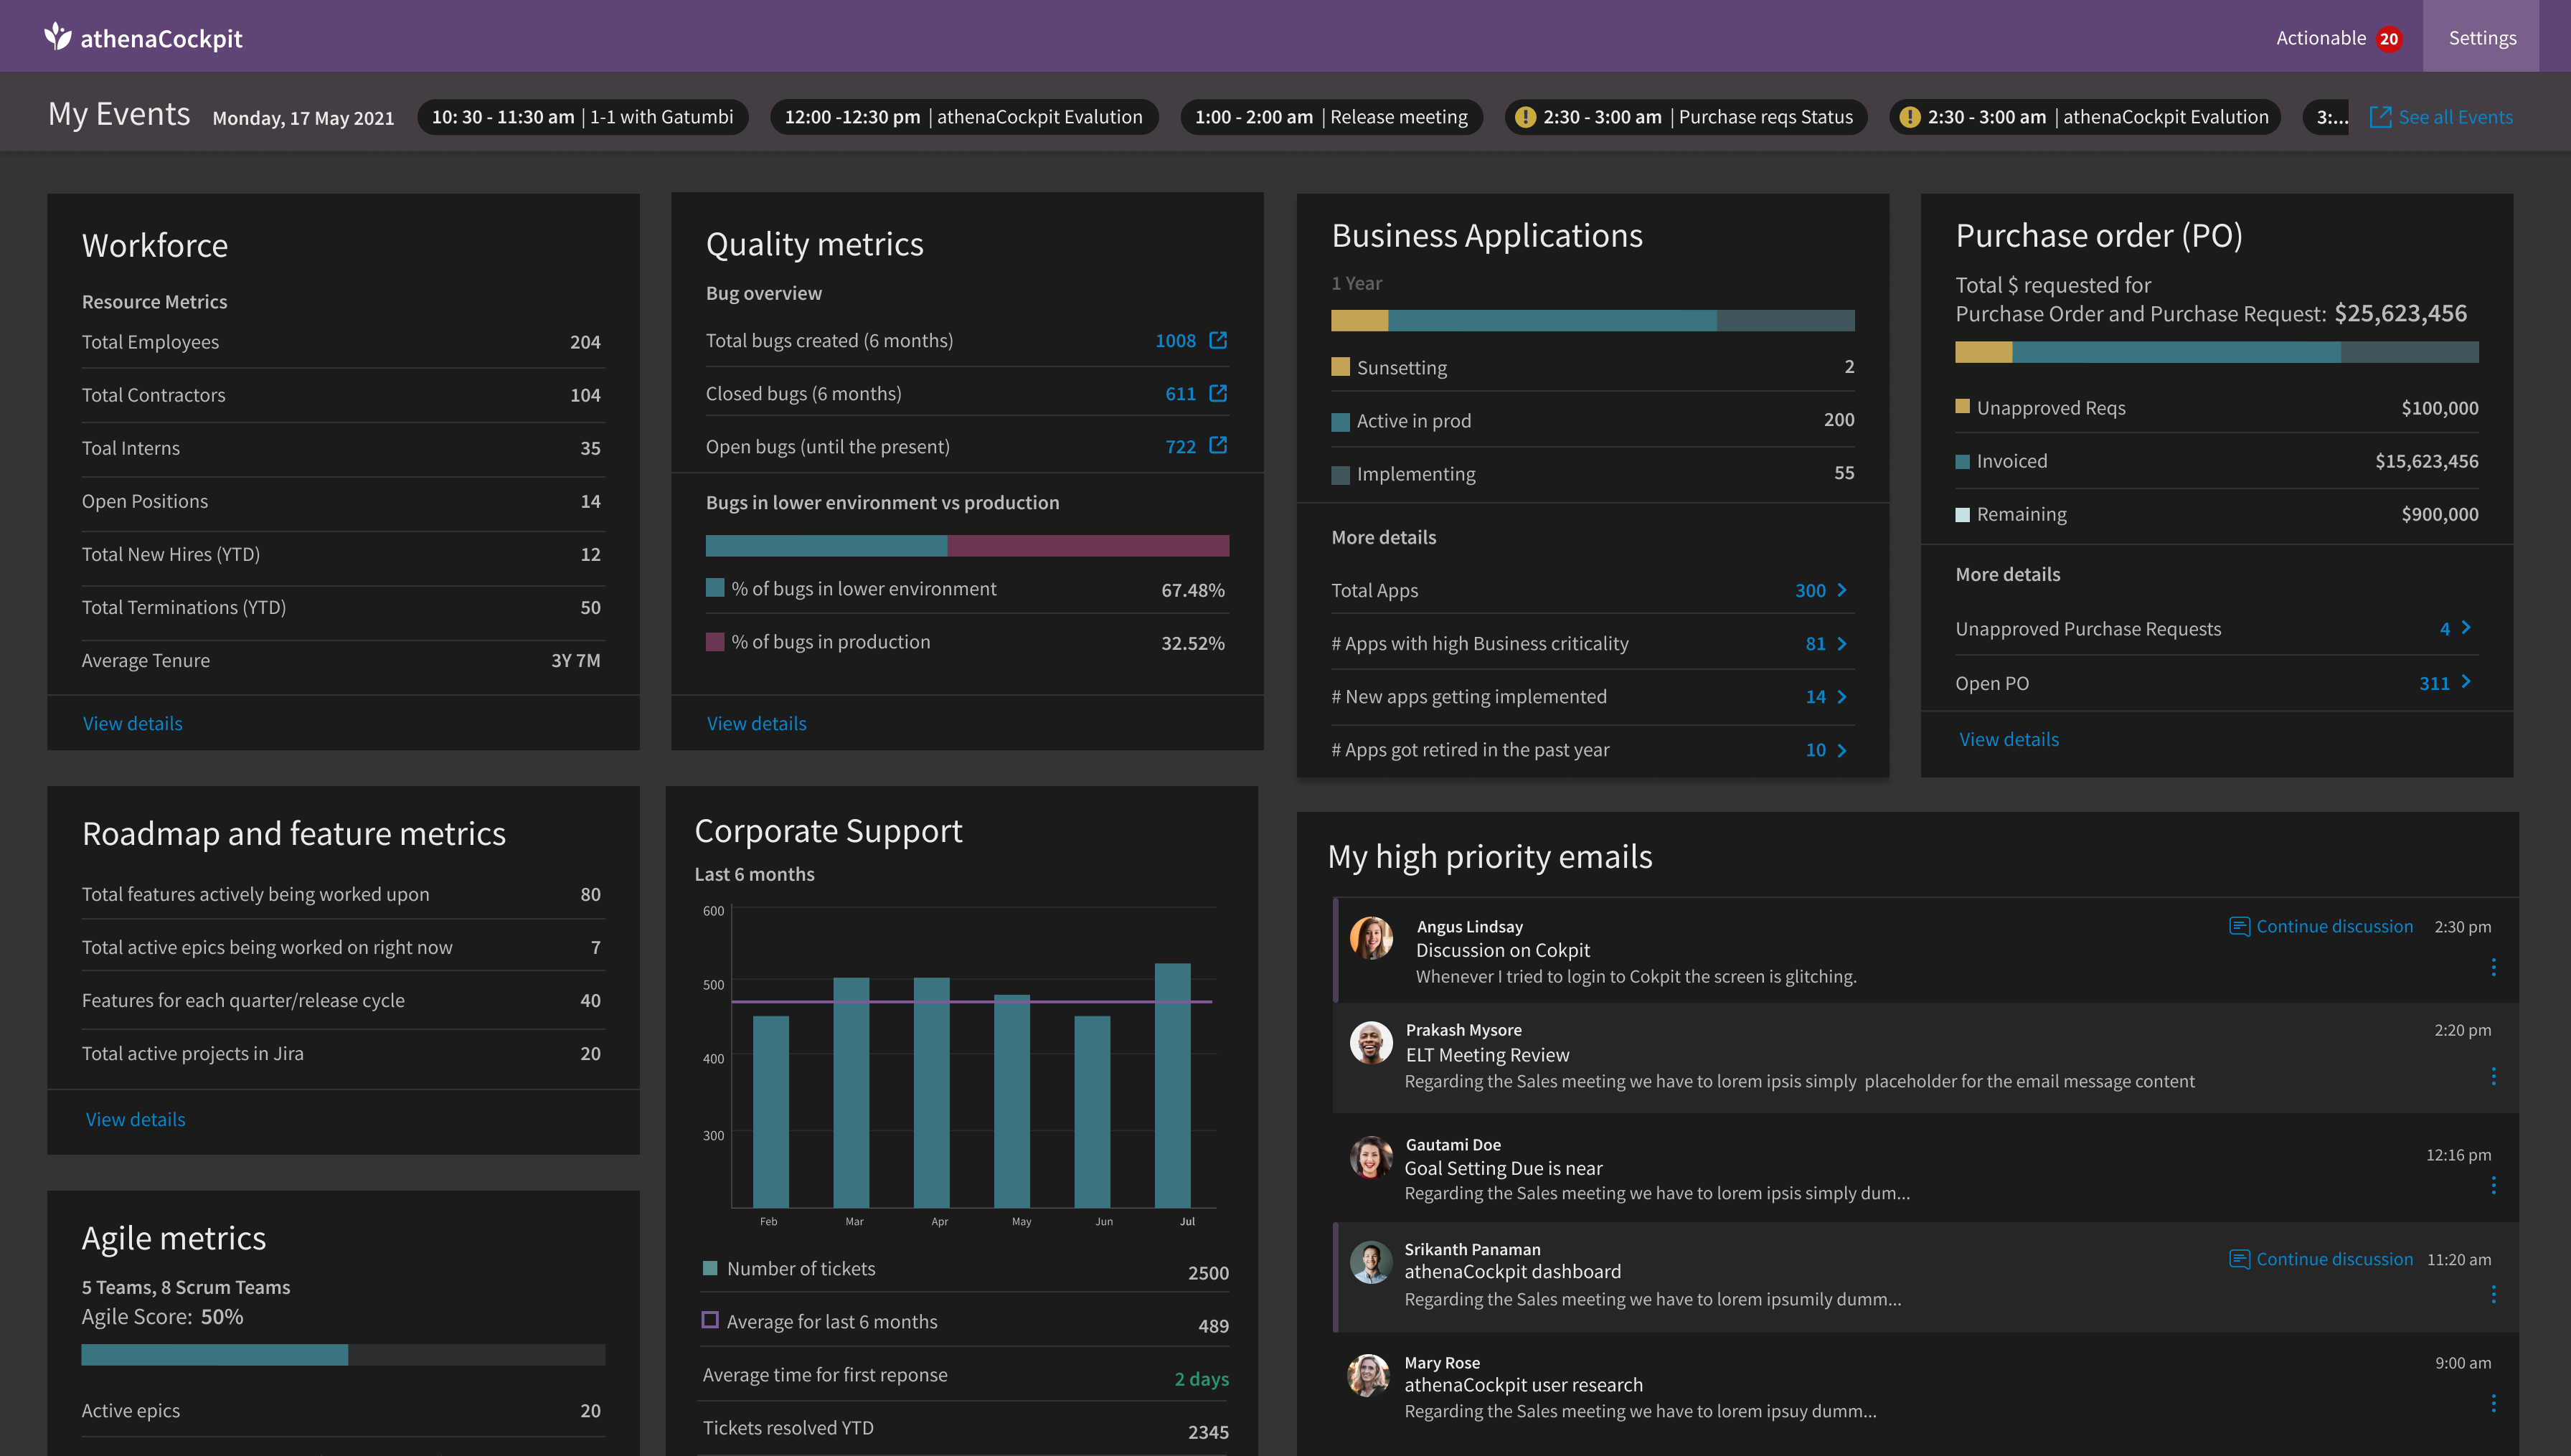
An internal dashboard that brought the signals leaders had been collecting from many places into one screen, organised by what needed their attention.
Outcome. Built and deployed for the leaders it was designed for, after interviews with seven of them. No usage figures are claimed.
- 7
- leaders interviewed
- 3
- zones: notice, monitor, act
- 1
- card pattern for every area
- 1
- screen in place of many places to check
My roleProduct designer, end to end · Interviewed seven leaders · Aligned the data owners on what each number meant · Designed the interface the team built and deployed
Organised by what it asks of a leader
Context to notice, health to monitor, then items to act on, instead of one panel per department.
Agreed numbers, named owners
I worked with each data owner to agree what every number meant, and who owned it.
One repeatable card
One consistent card made a dense screen easy to scan and easy to extend.
Full case study
Problem
- For the business. Leaders needed a picture across operational areas owned by different teams.
- For users. Understanding status and finding what needed attention meant checking several places.
- For the product. The dashboard needed to connect context, signals to monitor, and items requiring action in one view.
Context
Before my reporting work, I designed an internal dashboard for leaders. The people it served carried a lot at once: their teams and open roles, the quality of what was shipping, the applications they were responsible for, purchase requests waiting on them, the roadmap, and the support load coming in.
Each of those areas had its own owner and its own place to look. Getting a sense of how things stood meant visiting several of them, often before the first meeting of the day.
Role
- Role. Product designer, end-to-end experience
- Scope. Interviews, information architecture, and dashboard design
- Partners. Seven leaders and stakeholders who owned the data
- My contribution. Organized the view around leader intent: notice, monitor, then act
- Evidence. Seven leader interviews informed the content; the dashboard was built and deployed.
I was the designer on the project. I worked with the people who owned each area of data to agree on what the dashboard should show, interviewed seven of the leaders who would use it, and designed the interface that the team built and deployed.
Process
Many owners, one screen
Every card on the dashboard drew on a different team's information. So a large part of the work happened before any layout: sitting down with each owner to agree on a small set of numbers that said how their area was doing, what each number meant, and where someone should go when they needed the detail.
Those conversations kept the dashboard honest. A number that two teams defined differently would have done more harm than leaving it off.
Listening to the people it was for
I interviewed seven leaders who would use the dashboard. I wanted to understand which numbers they actually looked at, how often, and what they did next when something looked off. Those conversations decided what made it onto the screen, and just as much, what stayed in the source systems.
Key Decisions
Organised by what needs attention
The biggest layout decision was to arrange the screen by what each area asks of a leader, not by department. Read left to right, it moves from context, to health, to action: the left side helps a leader know how the organisation stands, the middle helps them watch for problems, and the right side holds what needs their action.
For your notice
Context about the organisation, read now and then.
- Workforce: headcount, open positions, hires, tenure
- Roadmap and feature metrics
- Agile metrics across teams
Keep an eye on
Health signals to watch for a trend, with a link out to the source system.
- Open bugs and how many reach production
- Support tickets against the six-month average
- Time to first response
Needs your action
Things waiting on this person, actionable from the dashboard.
- Unapproved purchase requests and open purchase orders
- Application decisions: sunsetting, implementing, high criticality
- High-priority emails to continue
More detail
The action side is where the work waits: purchase requests to approve, application decisions, and the priority emails that need a reply. The count of actionable items sits right above it, and the meetings flagged in the day's strip point to the same things. On a busy morning, a leader can go straight to the right side. On a quieter day, they can read across for the full picture.
How it played out in a day
Illustrative scenarios, written for this portfolio to show how the layout was meant to work. They are not research findings.
Read the three scenarios
Straight to what is waiting
A director has a few minutes before the day starts. The actionable count shows items waiting, and the right side shows four purchase requests still unapproved. A purchase status meeting later that day is flagged in the strip. She opens the requests from the arrow, approves what she can, and walks into the meeting knowing where things stand.
Seeing a problem before it is reported
On the middle column, the share of bugs reaching production has crept up, and support tickets sit above their six-month average. Nothing needs approval yet, but the link opens the bug tracker filtered to those issues, and the leader raises it with the team lead that afternoon instead of a week later.
Context without another report
Preparing for quarterly planning, a leader reads the left side: headcount and open positions, features in flight across the roadmap, and how the teams are tracking. It is the background they would otherwise have asked three people for.
What shaped the design
Every area reads the same way
Each card follows one pattern: a title, a handful of key numbers, at most one breakdown bar, and a way into the detail. Once you have read one card, you can read all of them.
The headline here, the detail at the source
Numbers link back to the system they came from. The dashboard stays a summary instead of becoming a second, out-of-date copy of every tool.
Start with the day
The day's meetings and a count of items waiting for action sit across the top, and high-priority email sits beside the metrics. It works as a starting point for the day, not only a scoreboard.
Quiet by default
A dark, low-contrast surface keeps attention on the numbers. Colour is saved for breakdowns and for the one marker that says something needs attention.
Outcome
The dashboard was built and deployed for the leaders it was designed for. I don't have usage data from that time, so I won't put numbers on its impact.
Lessons
- Alignment is part of the design. Agreeing on what each number meant, and who owned it, mattered as much as the layout.
- A repeatable pattern does a lot of work. One consistent card made a dense screen easy to scan and easy to extend.
- It shaped how I approached reporting later. Seeing how much depends on trusted, well-defined numbers carried straight into my work on reporting.